Atlas
Introduction
Keystrike Atlas provides real-time visibility into remote access activity across the organization’s environment.
Lightweight agents monitor inbound and outbound remote access activity, including RDP, SSH, PsExec, WinRM, WMI, SMB, VNC, Telnet, and FTP connections, and report this activity to the Keystrike platform. The Admin Panel provides an interactive network graph with search, filtering, and natural-language querying.
Atlas provides visibility into connections, clients, users, servers, and jump hosts, helping identify unknown clients, unmanaged servers, and unexpected or unsanctioned remote access activity. It provides the visibility layer alongside Keystrike Core Protector, which can enforce controls against unauthorized RDP and SSH access and activity.
Atlas reporting from devices, can be enabled/disabled via Configuration/Atlas in the admin panel. By default Atlas is enabled when organizations sign up.
Version 4.0 or higher is required for clients / terminators to be reporting Atlas data
Overview
All remote access connections within the selected time period are displayed. By default, the time window is set to the last 4 hours.
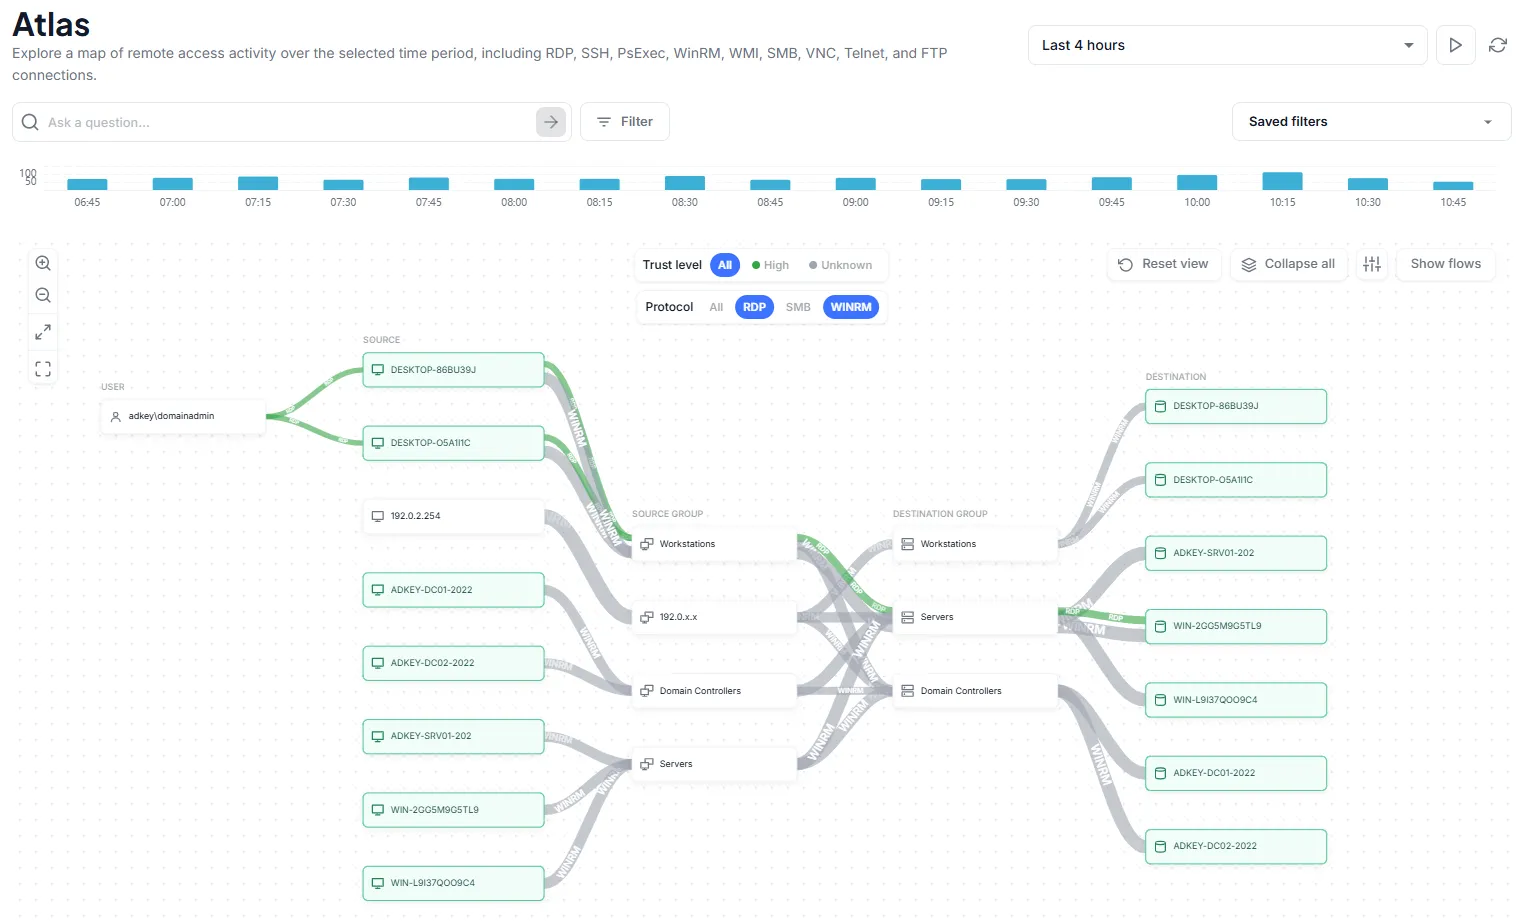
Graph controls
Use the controls around the graph to adjust how connections are displayed. These controls change the visualization without changing the underlying connection data or active filters. Navigation controls on the left side of the graph let you explore the visualization:
- Zoom in / Zoom out - Increase or decrease the level of detail shown in the graph.
- Fit to view - Adjust the graph so that the displayed connections fit within the available area.
- Full screen - Expand the graph to use the available screen space.
Controls in the upper-right corner provide additional options for organizing and displaying the graph:
- Reset view - Return the graph to its default layout and view.
- Expand/Collapse all - Expand or collapse grouped nodes to show or hide their individual members.
- Display settings - Control how nodes are grouped and displayed.
- Show flows - Display details about the connection flows between sources and destinations.
Ask a question
You can filter the graph using natural-language queries in the language of your choice. Your query is converted into a filter, which you can then save for future use.
Sample queries are displayed when the page loads and when you hover over the query field.
Examples include:
- Connections from user "Mike"
- SMB version 1 connections
- SSH in the past 2 weeks
- Connections from IP starting with 192.168
- RDP connections since 9am this morning
- PsExec tengingar í dag
- Conexiones del usuario "administrator"
- Connections to terminator devices
- Connections to PROD-DB
- Connections to group “Domain controllers”
- Duration over 60 seconds
- Connections from an unknown device
Filters
Filters let you narrow the connections displayed in the graph to the activity you want to investigate. You can create a filter in two ways:
- Ask a question using the natural-language query field, as described above. The question is automatically converted into filter conditions.
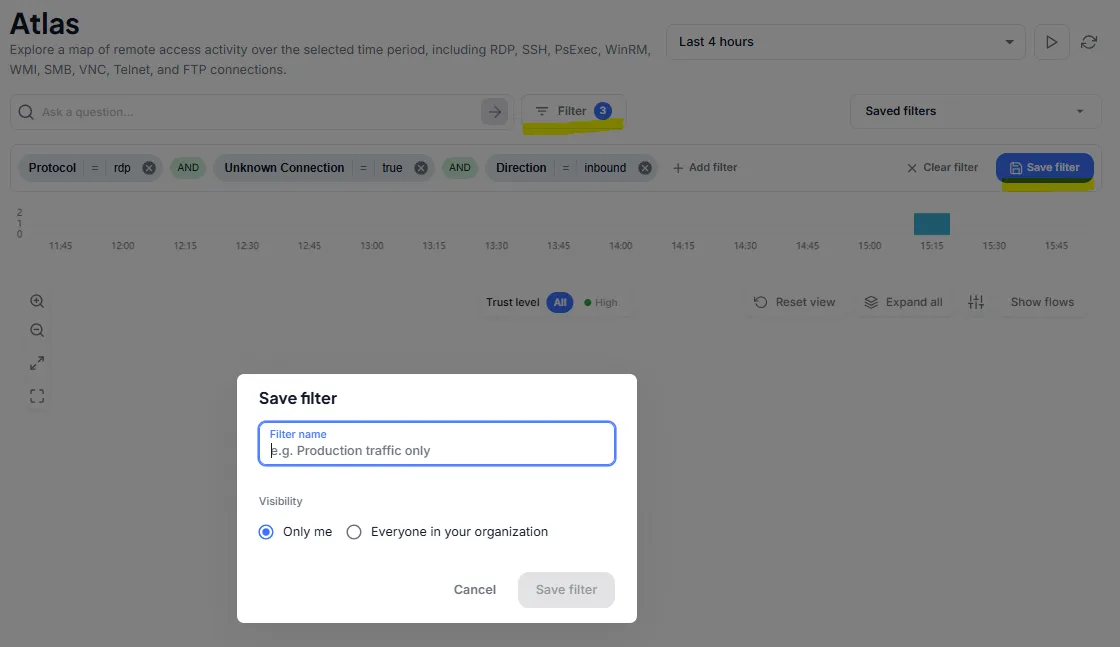
- Build a filter manually by selecting Filter and choosing the fields, operators, and values you want to use.
A filter can contain multiple conditions. Add or remove conditions as needed to refine the results displayed in the graph. For example, you could filter for inbound RDP connections from unknown devices, or combine protocol, user, device, and connection properties to investigate more specific activity.
Saving filters
If you expect to use a filter again, select Save filter and give it a descriptive name. When saving a filter, you can choose its visibility:
- Only me - The filter is available only to you.
- Everyone in your organization - The filter is available to all administrators in your organization.
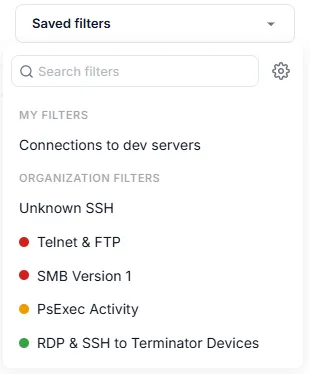
Saved filters can be accessed from the Saved filters dropdown. Filters are grouped by visibility, making it easy to distinguish your personal filters from filters shared across the organization. Selecting a saved filter applies its conditions to the graph, allowing you to quickly return to frequently used views without rebuilding the filter.
Managing saved filters
Saved filters can be managed by selecting the gear icon in the Saved filters dropdown.
The Manage filters dialog organizes filters into the following sections:
- My filters - Private filters that only you can view and manage.
- Organization filters - Shared filters available to all administrators in your organization.
- Trust levels - Shared filters used to classify connections by trust level.
For each saved filter, the dialog shows information such as the number of conditions it contains. Organization filters may also show when the filter was created and who created it.
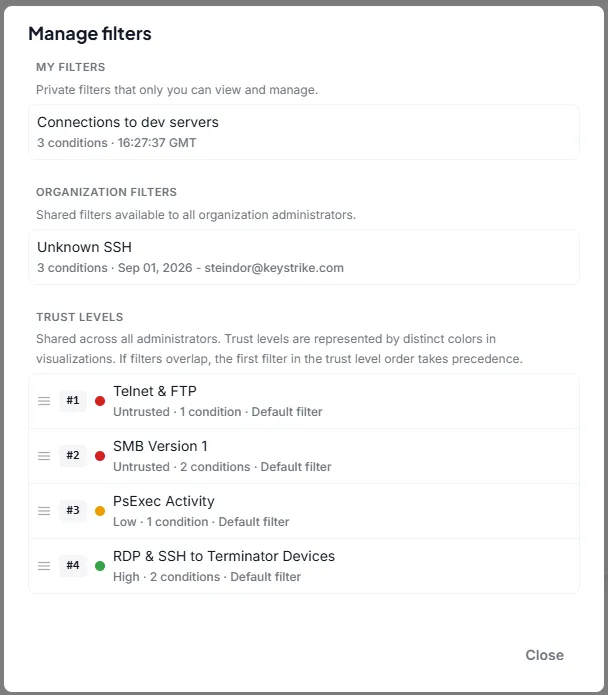
Trust levels
Trust levels classify connections based on conditions defined by your organization. Each trust level is represented by a distinct color in the Atlas visualization, making it easier to identify connections that may require attention.
Quick filters for trust levels are available at the top of the graph. Use these to show connections for a specific trust level, such as High, Medium, Low, Untrusted, or Unknown, or select All to display connections regardless of trust level.

Defining a trust level
You can create a new trust-level filter by saving a filter and making it available to everyone in your organization. When saving the filter:
- Enter a descriptive Filter name.
- Select Everyone in your organization under Visibility.
- Enable Define trust level with this filter.
- Select the appropriate Trust level.
- Select Save filter.
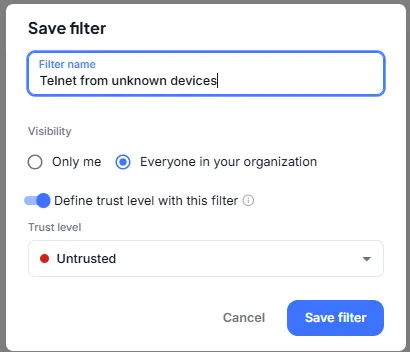
The saved filter is then used to classify connections that match its conditions. For example, you could create a filter for Telnet connections from unknown devices and assign those connections the Untrusted trust level.
Trust-level precedence
A connection may match more than one trust-level filter. When this happens, the order of the filters determines which trust level is assigned. Trust-level filters are evaluated in the order shown in the Manage filters dialog. The first matching filter takes precedence. You can change the evaluation order by dragging trust-level filters into the desired position. The number beside each filter indicates its current precedence. For example, if a connection matches both an Untrusted filter and a Low trust filter, and the Untrusted filter appears first, the connection is classified as Untrusted.
Default trust levels
Atlas includes default trust-level filters for common types of remote access activity. Default filters are identified by the Default filter label in the Manage filters dialog.
Default filters can be edited or deleted by an administrator. This allows organizations to adapt the default trust-level classification to their own security policies and environment.